Measuring meaningful metrics
All metrics are shortcuts. When we're faced with uncertainty, we use metrics to break our problem down into simpler, tangible pieces that we can understand.Metrics are simple proxies that allow us to transform difficult questions into empirical, demonstrable ones.
When we're faced with a difficult question, we often answer an easier one instead, usually without even noticing this subtle substitution. This is what economists call an availability heuristic — a mental shortcut where we use what we already know, rather than complete information, when making a decision.
History is filled with examples of people who used a similar approach to solve complex problems. One of the best examples of this is the story of the map of the London Underground.
The London Underground officially opened in 1863. Despite being such a revolutionary way for moving people around the city, the Underground Electric Railways Company still had to convince people to actually use it.

The map was a perfect representation of the city. It was precise and detailed, and different colors were used to indicate the different lines, with circles to highlight the various stops.
However, Londoners found it too complex and confusing.
Over the next 10 years, a variety of geographical maps were produced. They changed sizes, lines widths, colors, fonts, legends over and over again.

In, 1931 the operators took a chance on a new, "radical" map designed by a former Underground Electric Railways Company draughtsman and printed a few copies. His name was Harry Beck and this was his map.
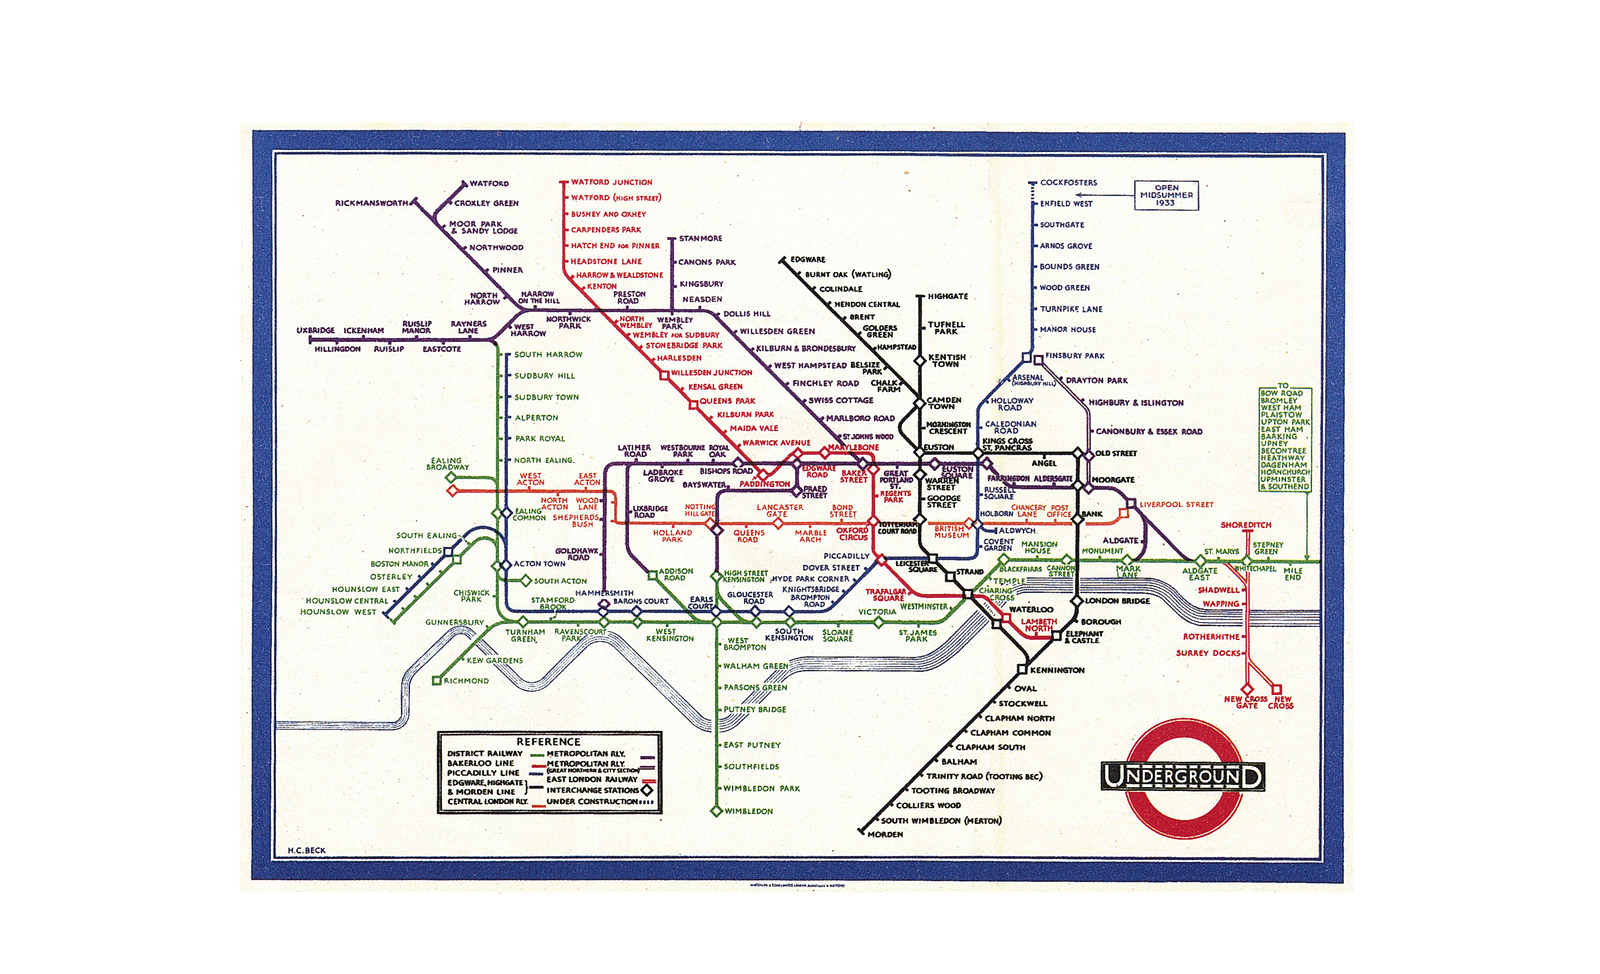
Beck's Tube Map
Beck came up with a completely new design with:
- Only 45- and 90-degree angles.
- No geographical references: No streets, no parks, no churches.
- Stops were represented with equal distances.
Today, the London Underground map is by far the most famous map in the world. Years later, it became the standard for every underground in the world.
The danger of me-too thinking and the Survivorship Bias
In the era of SaaS and digital products, our strongest convictions are powerfully swayed by what other businesses are doing. Their core metrics become our core metrics, their best practices become our best practices, and their benchmarks for success become ours.This way of thinking causes many businesses to become victims of survival bias. This happens when we focus too narrowly on those who have been successful and overlook the companies and entrepreneurs who didn't quite make it. This can lead us to draw a number of false conclusions about the reason for their success.
We see this happening when businesses with different products, different value chains, and different core values level out on the same metrics and, even worse, optimize for those same metrics. These bad habits make businesses think of their products in the exact same way, and it pushes the proliferation of "me-too" strategies.
Entering a Post-Click Era
We know that the number of lines of code is a bad proxy metric for measuring the quality of the output of a software engineer. We know that the number of hours spent at the office is a bad proxy metric for productivity. And while we are fully aware that certain proxy metrics are wrong, we're often not willing to do the extra work required to go beyond standard industry practices. Here are a few examples of benchmarks that are no longer effective:1. Pageviews
According to Wikipedia, a pageview is a request to load a single HTML file (web page) of an internet site. The web page loads some analytic tracking code and sends an event to a back-end server. This metric is thought to be a good estimation of your page's impressions (aka views).This has worked pretty well for the last 10 years, but think about you browse the internet today. If you're like most people, you always have gmail.com open in your browser and you just switch tabs to check for new email without reloading the whole page. You probably do the same thing on Twitter, Facebook and with lots of other products.
When this behavior stops being a marginal case and becomes the way everyone uses the internet, pageviews become a misleading and unreliable indicator.
As suggested by Google engineer, Phil Walton here, instead of tracking how many times a page is loaded, we should track how many times it was viewed using the Page Visibility API.
2. Engaged users
The more users actively use your product, the more they should care about it. Right? Engagement is one of the best predictors of success. For years, this simple equation has been considered the bedrock of every successful software product.While this is still valid for a lot of consumer products, it's not valid for a wide range of SaaS products where the software works in full autonomy.The product (1) understands the problem, (2) works out a solution and (3) outputs a result. These products don't need human interaction at any level of their value-chain and therefore, optimizing for "engagement" doesn't make sense. Engagement is not the silver bullet metric for every SaaS. Don't take this for granted. I extensively discussed this idea in a recent post: The Next Generation of SaaS Won't Optimize for User Engagement.
3. Time spent & bounce rate
High time spent is good. High bounce rate is bad. We're used to the idea of time spent as a proxy metric for "interesting content" and high bounce rate a proxy metric for "bad content".That's so untrue. Just because people spend time on your article page doesn't necessarily mean that they were actually interested in what you wrote. For website content, the ratio of unique views versus "read" is a much better metric for success.
It's no surprise that Pete Davies and Medium rejected the idea of time spent on page and replaced it with Total Time Reading (TTR).
We measure every user interaction with every post. Most of this is done by periodically recording scroll positions. We pipe this data into our data warehouse, where offline processing aggregates the time spent reading (or our best guess of it): we infer when a reader started reading, when they paused, and when they stopped altogether. The methodology allows us to correct for periods of inactivity (such as having a post open in a different tab, walking the dog, or checking your phone).
The aggregate Total Time Reading (TTR) is a metric that helps us understand how the Medium platform is doing as a whole. We can slice that number in lots of ways (logged-in vs. logged-out, new posts vs. old, etc.).
4. Open rate and click rate for notifications
High open rates mean they want to hear from you. High click rates mean that what you sent them is relevant.Suppose you sell online courses and you're sending triggered notifications to users who didn't complete a course. At this point, looking at open rates and click rates doesn't really matter as your ultimate goal is having users complete what they started.
The ratio of users who got the notification versus users who completed the course would be a much better metric for success.
Notifications are good when they're able to deliver real value to the user. You can't know the actual value delivered but you can select the indicators that are an actually better predictor of success.
#5. Refunds
At the end of the day, businesses optimize for increasing revenues. This leads most businesses to see refunds as an obstacle to revenue. The fewer refunds you have, the better.
When every other retailer was trying to drive down returns, Zappos chose to optimize the process, making the return not just a normal part of shopping, but a delight.
While looking at the wrong proxy metrics can distract organizations from the real benchmarks that do matter, things can get seriously worse when they optimize for those bad metrics. This is where adopting the wrong metrics (and optimizing for them) can seriously affect your growth and negatively impact your customers. British economist, Charles Goodhart explained this in the Goodhart's law:
When a measure becomes a target, it ceases to be a good measure.
As a result, teams start focusing on lifting engagement by sending nonsense notifications that users don't really care about. They use emoji in email subject-lines because they have higher open rates, they hide no-refund policies in the service terms or in FAQs their users will never read. In time, this leads to a death spiral of misplaced attention; the longer you focus and optimize irrelevant metrics, the further and further away you move from the metrics that do matter for your business.
Before you know it, you will find yourself trying to desperately justify your new content strategy, your new product decisions, your new customer support line. You will eventually realize that your business hasn't improved because you've spent too long looking at the wrong benchmarks for success.
The Need for Holistic Thinkers
When Harry Beck created his Tube map, he really did just one difficult thing: He was able to understand what users needed. He realized that a more detailed map placed a higher cognitive load on the user, making it more difficult for them to make a decision.Instead, he created a map that didn't look like a map at all. We need people who are able to go beyond the prevailing wisdom and common standards. When they pick up their core metrics, they need to be able to think about their organizations, their products and their strategies in a holistic way.
We need people who truly understand customer behavior and who are great at optimizing for the value delivered rather than magician good at optimizing for short-term value. We need companies who truly understand that marketing, product and customer support go hand-in-hand as one big organism and who are focused on constantly improving their customer experience rather than merely lifting up industry-approved metrics.

0 comments:
Post a Comment